上次安裝Python之後,用matplotlib秀出多個子圖時出現警告。
主要是"新版matplotlib"中的plt.subplots有更改,現在直接建立一次就好。
先看程式碼
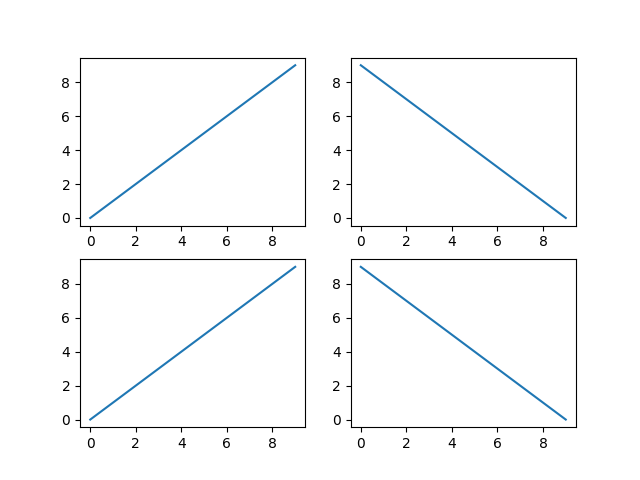
fig, ax = plt.subplots(2,2)
ax[0,0].plot(np.arange(10))
ax[0,1].plot(np.arange(10)[::-1])
ax[1,0].plot(np.arange(10))
ax[1,1].plot(np.arange(10)[::-1])
plt.show()
-
fig, ax = plt.subplots(2,2)中的ax就是存放四個子圖的地方 -
可以像
numpy一樣直接指定位置,如第2行ax[0,0].plot(np.arange(10))一樣 -
都設定完之後,最後用
plt.show()顯示這些圖表。
這樣秀出來的圖就會有四個圖表了